Configuring Alarm Thresholds for Performance Monitoring
The Alarm Thresholds table lets you configure up to 100 customized alarm threshold rules for any of the device's performance monitoring parameters. These alarms are sent by the device through SNMP as SNMP trap events, notifying the SNMP manager of alarm severity level changes in performance monitoring parameters.
For each performance monitoring parameter(s), you can configure an Alarm Threshold rule with the following:
| ■ | Thresholds: |
| ● | You can configure a threshold value that if crossed by the performance monitoring parameter raises an alarm. This is referred to as the raise watermark. |
| ● | You can configure a threshold value that if crossed by the performance monitoring parameter clears a raised alarm. This is referred to as the clear watermark. |
The area between these two thresholds provides a hysteresis. This allows fluctuation between the thresholds and eliminates false alarms.
| ■ | Threshold crossing direction to raise or clear the alarm: |
| ● | You can configure the alarm to be raised when the performance monitoring parameter result becomes greater than the raise watermark threshold and cleared when it becomes less than the clear watermark threshold. This is referred to as the up direction. |
| ● | You can configure the alarm to be raised when the performance monitoring parameter result becomes less than the raise watermark threshold and cleared when it becomes greater than the clear watermark threshold. This is referred to as the down direction. |
| ■ | Alarm text (description) that is displayed when the alarm is raised or cleared. |
| ■ | Alarm severity level of the raised alarm (e.g., Major). If you want alarms raised for different threshold crossings where each threshold has a different severity level, you need to configure multiple Alarm Threshold rules for the same performance monitoring parameter. Each rule will have different thresholds and different severity levels. For example, if you want two alarm severity levels (Major and Minor) for a performance monitoring parameter, the following two Alarm Threshold rules need to be configured for that performance monitoring specific parameter: |
|
Parameter |
Rule #1 |
Rule #2 |
|---|---|---|
|
'Raise Watermark' |
40 |
20 |
|
'Clear Watermark' |
30 |
10 |
|
'Severity' |
Major |
Minor |
When multiple severity levels are configured for a performance monitoring parameter, the device raises or clears the different alarm severity levels according to a certain logic, explained using scenarios (chronological) base on the above configuration example:
| a. | Performance monitoring parameter measurement increases to 25: A minor alarm event message is sent. |
| b. | Performance monitoring parameter measurement increases to 63: A major alarm event message is sent; no clear minor alarm event message is sent. |
| c. | Performance monitoring parameter measurement decreases to 27: Another minor alarm event message is sent; no clear alarm event messages are sent for the previous minor and major alarms. |
| d. | Performance monitoring parameter measurement decreases to 9: A clear minor alarm event message is sent. |
A performance monitoring parameter may match multiple threshold alarms definitions. As a result, multiple thresholds may be crossed simultaneously. However, the device raises only one threshold alarm at a time. The device regulates for which of the crossed thresholds to raise an alarm:
| ● | Among the crossed threshold alarms that the performance monitoring parameter is associated with, an alarm event is sent only for the one with the highest severity. |
| ● | The device sends a clear alarm event only when there are no currently crossed threshold alarms. |
| ● | The device may send multiple raised alarm events if multiple threshold alarms partially overlap. |
The following illustration provides an example of an alarm threshold configured for the up direction:
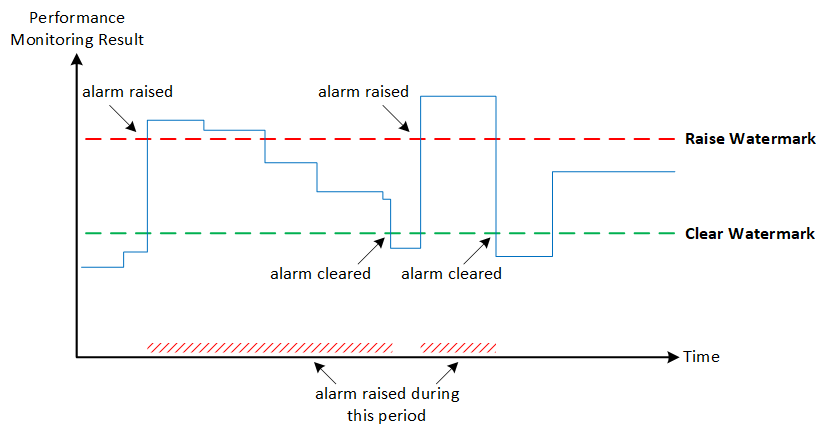
As shown in the illustration, the alarm is only raised once it crosses the raise watermark threshold in the up direction (i.e., performance monitoring parameter value is greater than the threshold). The raised alarm is only cleared when it crosses the clear watermark threshold.
The following procedure describes how to configure alarm threshold rules through the Web interface. You can also configure it through ini file [PMAlarmThresholds] or CLI (configure system > kpi alarm-thresholds).
For alarm threshold functionality, you must also enable the device to send SDRs to a syslog server. For more information, see the 'SDR Syslog' parameter in Configuring SDR Reporting to Syslog Server.
| ➢ | To configure an alarm threshold: |
| 1. | Open the Alarm Thresholds table (Setup menu > Administration tab > Performance Monitoring folder > Alarm Thresholds). |
| 2. | Click New; the following dialog box appears: |
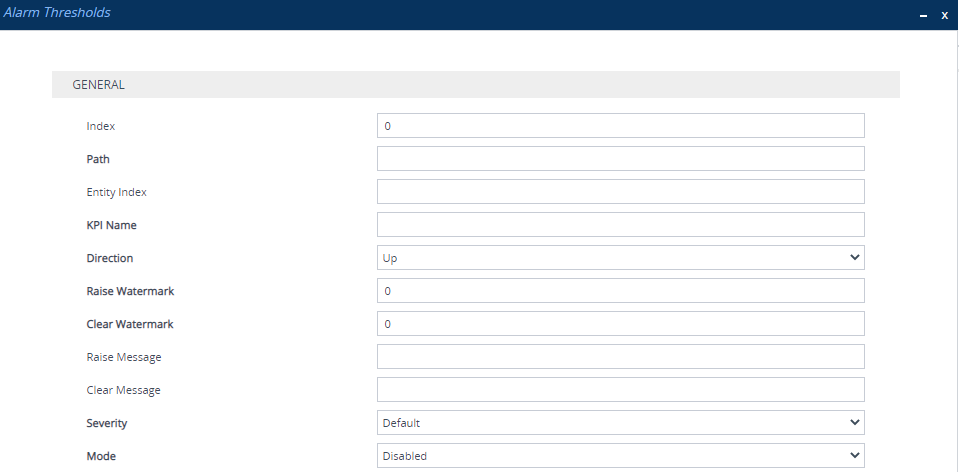
| 3. | Configure an alarm threshold rule according to the parameters described in the table below. |
| 4. | Click Apply. |
Alarm Thresholds Table Parameter Description
|
Parameter |
Description |
||||||||||||||||||||||||
|---|---|---|---|---|---|---|---|---|---|---|---|---|---|---|---|---|---|---|---|---|---|---|---|---|---|
|
'Index' [Index] |
Defines an index number for the new table row. Note: Each row must be configured with a unique index. |
||||||||||||||||||||||||
|
'Path' pm-path [PMPath] |
Defines the path (application name, group name and element name) of the performance monitoring parameter. The valid value is a string of characters (case insensitive), where the path names are separated by forward slashes (/). For example, the path of the licenseFeuUsage performance monitoring parameter is "system/licensestats/global". The valid value is a string of up to 119 characters (case insensitive). Note:
|
||||||||||||||||||||||||
|
'Entity Index' entity-index [EntityIndex] |
Defines a specific index row of the entity with which the performance monitoring parameter is associated. For example, you may want to configure this Alarm Thresholds rule only for IP Group #7. The value can be a numerical index of an instance (e.g., "7"). For all indices (e.g., all IP Groups), leave the parameter's value empty. To configure a range of indices, use the syntax x-z (e.g., "1-4"). To configure multiple indices that are not consecutive, separate each by a comma without spaces before or after (e.g., “1-2,5”). |
||||||||||||||||||||||||
|
'KPI Name' kpi-name [KPIName] |
Defines the name of the performance monitoring parameter for which this alarm threshold rule applies. The valid value is a string of up to 255 characters (case insensitive). To configure the parameter with multiple performance monitoring parameters, separate each parameter by a comma without spaces before or after (e.g., "licenseFeuUsage,licenseSbcSignalingUsage"). Note:
|
||||||||||||||||||||||||
|
'Direction' threshold-direction [Direction] |
Defines the direction of crossing the threshold values (watermarks) for which the alarm is raised or cleared.
For example, assume that you configure the parameter to Down, the 'Raise Watermark' parameter to 50 and the 'Clear Watermark' parameter to 60. When the performance monitoring parameter's value becomes less than 50 (e.g., 45), an alarm is raised. When the performance monitoring parameter's value becomes greater than 60 (e.g., 62), the alarm is cleared. Note: The parameter is mandatory. |
||||||||||||||||||||||||
|
'Raise Watermark' threshold-raise-watermark [RaiseWatermark] |
Defines a value that if crossed by the performance monitoring parameter, raises the alarm. The valid value is a number. Note: The parameter is mandatory. |
||||||||||||||||||||||||
|
'Clear Watermark' threshold-clear-watermark [ClearWatermark] |
Defines a value that if crossed by the performance monitoring parameter, clears the raised alarm. The valid value is a number. Note:
|
||||||||||||||||||||||||
|
'Raise Message' threshold-raise-message [RaiseMessage] |
Defines the alarm text that is displayed when the alarm is raised. The valid value is a string of up to 80 characters. You can also use the following placeholders in your customized text, which the device replaces with the actual value:
For example: "The %PM% parameter value (%VALUE%) has exceeded the high threshold (%RAISEWM%)." |
||||||||||||||||||||||||
|
'Clear Message' threshold-clear-message [ClearMessage] |
Defines the alarm text that is displayed when the alarm is cleared. The valid value is a string of up to 80 characters. You can also use the following placeholders in your customized text, which the device replaces with the actual value:
For example: "The %PM% parameter value (%VALUE%) has returned to below the high threshold value (%RAISEWM%)." |
||||||||||||||||||||||||
|
'Severity' threshold-severity [Severity] |
Defines the severity level of the alarm.
|
||||||||||||||||||||||||
|
'Mode' threshold-mode [Mode] |
Enables (activates) the Alarm Threshold rule.
|